foodCO2
Interactive Installation
by Benjamin Drieschner
Do you know the carbon footprint of your diet? foodCO2 visually shows you the CO2 footprint of various foods.
One of the main factors of human-induced climate change is human nutrition. Agriculture, transport, production, etc., release carbon dioxide, which contributes to global warming through the greenhouse effect. foodCO2 visually shows the CO2 footprint of various foods. A conscious diet can contribute to climate protection and promote our health.
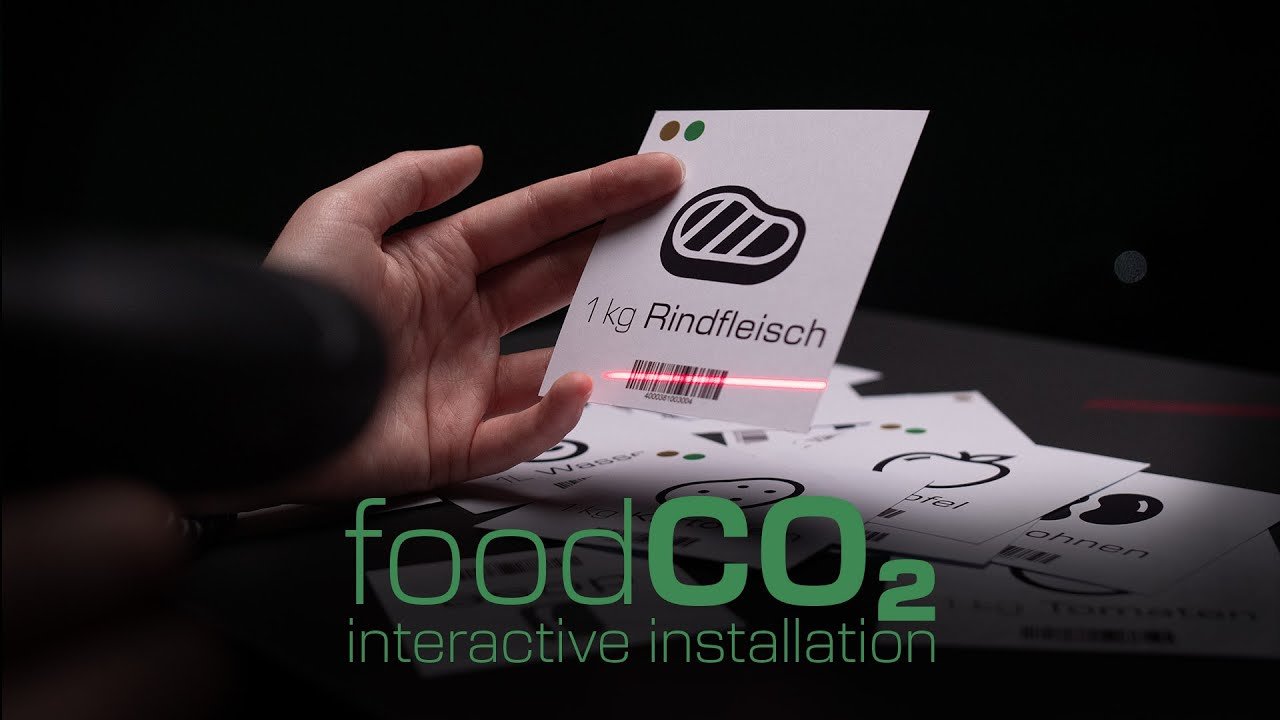
In the interactive media installation foodCO2, you can learn how much CO2 a food item has emitted when it passes over the checkout in the supermarket. Additionally, you can add tags such as bio, canned, or reusable glass bottle to see how these additional factors affect the CO2 footprint.
There are paper tags with a picture of a product, the name with the weight (always 1kg), a barcode, and small colored circles in the top left corner indicating which tags can be used. A 1m³ cube is projected on a screen. You can scan the barcodes of the tags with a barcode scanner, and the product name and the amount of CO2 emitted in kg will appear on the cube. The cube also fills with a color to show how many liters of carbon dioxide are released, with the liter number appearing on the color. You can then scan a tag, such as “bio” and the values will adjust according to the additional factor.
Source Study:
Ökologische Fußabdrücke von Lebensmitteln und Gerichten in Deutschland Guido Reinhardt, Sven Gärtner, Tobias Wagner
Heidelberg, 2020
Created in the course “Media Installations and Interactive Prototyping”
Hochschule Mainz – University of Applied Sciences – Timebased Media
Supervision: Prof. Benjamin Hohnheiser
Thanks to
Sophie Teufel
Meike Schalk
Benjamin Hohnheiser
KjG Mainz-Laubenheim